
Do you want to add an attractive and functional Line Chart Widget to your WordPress website using Elementor? But don’t know the process of using it? Don’t worry! We are here to help you.
What is Line Chart on a website?
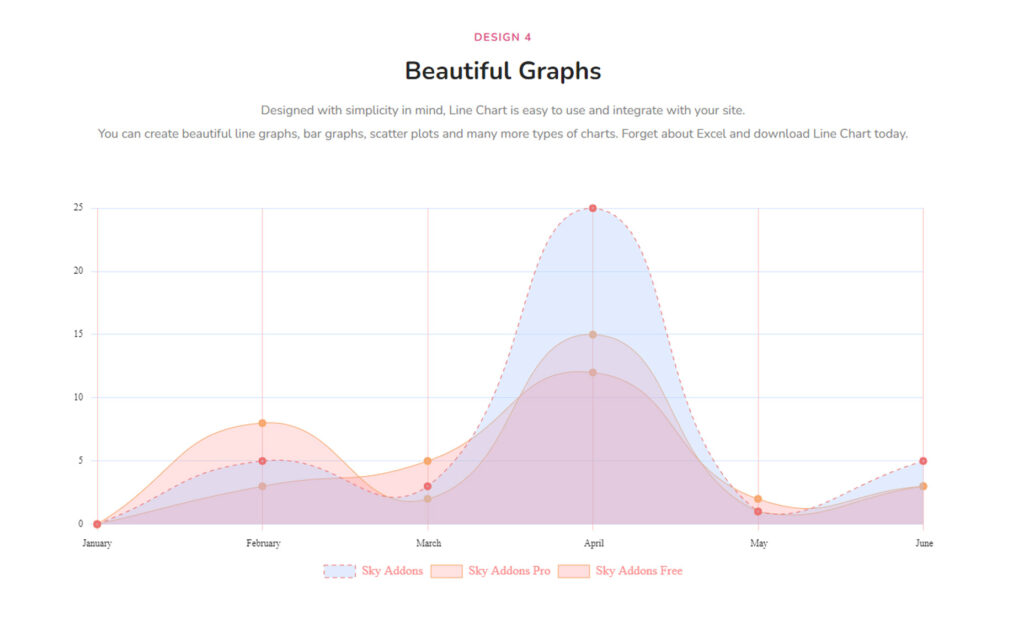
A line chart is a type of chart that displays data as a series of points connected by straight lines. Line charts are used to represent continuous data over time, such as stock prices, temperatures, or sales figures, and are particularly useful for showing trends or changes in data.
Line charts can also be used to Compare Multiple Data Sets or to display patterns or relationships between variables. By using a line chart, viewers can quickly see patterns, changes, and fluctuations in data, making it an effective way to visualize and understand data.
What is the importance of Line Charts?
Line charts are a great way to visualize changes in data over time, they can be used to easily identify patterns and trends in data, as well as compare different sets of data. Line charts allow for quick and easy visualization of data, making them a great choice for presentations. Line charts are also easy to read and interpret, which makes them a great choice for presenting data to a wide audience
Line charts are important in websites for the following reasons:
- Data Visualization: Line charts provide a clear visual representation of data, making it easier to understand trends, patterns, and fluctuations.
- Trend Analysis: Line charts can be used to visualize trends over time, making it easy to identify changes and fluctuations in data.
- Comparison: Line charts allow the comparison of multiple data sets, making it easier to understand the relationships between them.
- Engagement: Line charts can make data more engaging, as they provide a visual representation of the data, making it easier for users to understand the information being presented.
- Data Storytelling: Line charts can be used to tell a story with data, highlighting the most important information and helping to engage and educate viewers.
- Mobile-Friendly: Line charts are lightweight and can be optimized for mobile devices, making them accessible to a wider audience.
Sky Addons Line Chart Widget in Elementor is a great solution for anyone looking to effectively display data in an engaging and easy-to-understand manner. This is a User-Friendly and Cost-Effective plugin created for Elementor.
First, we are showing you a short summary of using the Line Chart widget provided by Sky Addons.
To use the Line Chart Widget in Elementor, you can follow these steps:
- Install the Sky Addons plugin: You can download the plugin from the WordPress repository or through the plugin section of your WordPress dashboard.
- Open Elementor Editor: Open the page or post where you want to add the line chart and click on “Edit with Elementor.”
- Add Line Chart Widget: Click on the “Add Widget” button, and search for “Sky Addons Line Chart.” Drag and drop the widget into the page.
- Configure Settings: In the widget settings, you can configure the data source, chart type, and chart options such as axis labels, colors, and more.
- Enter Data: You can enter the data for your chart in the data table. You can also import data from a CSV file.
- Customize Style: You can customize the style of the chart, including the colors, font size, and more, using the style tab in the widget settings.
- Preview and Publish: Preview your chart, and if everything looks good, publish the page or post.
Now let’s jump into learning the detailed process of using the Line Chart widget.
To Insert Widget
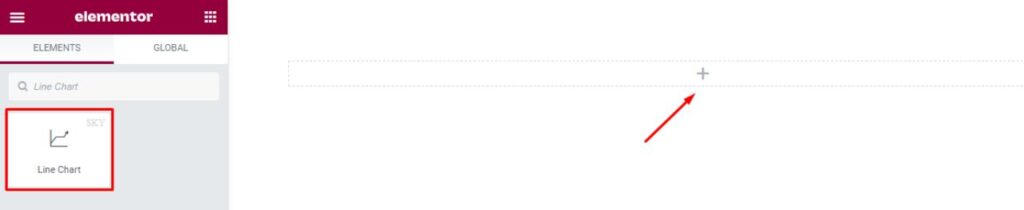
Firstly go to your Elementor Editor Panel and find the Line Chart widget of Sky Addons and then simply drag and drop it into the selected section.
Content Tab
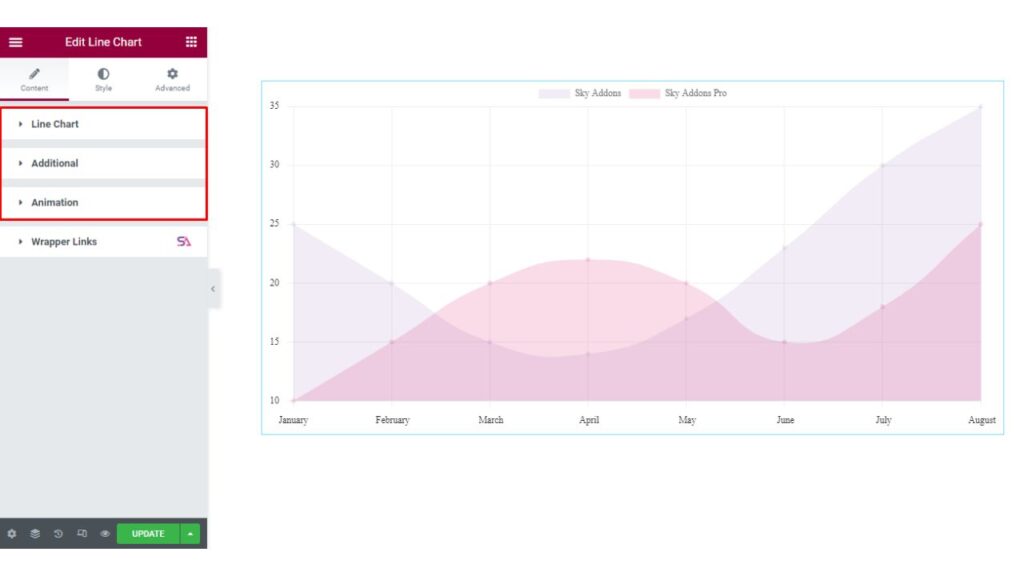
By clicking the widget, you will be able to access three blocks with different settings: Content, Style, and Advanced.
Now in the Content tab, there are three sections. In the Content tab here you can adjust the needed settings that define the widget’s content.
Under the Content tab, you will find 3 sections. They are Line Chart, Additional, and Animation.
Line Chart
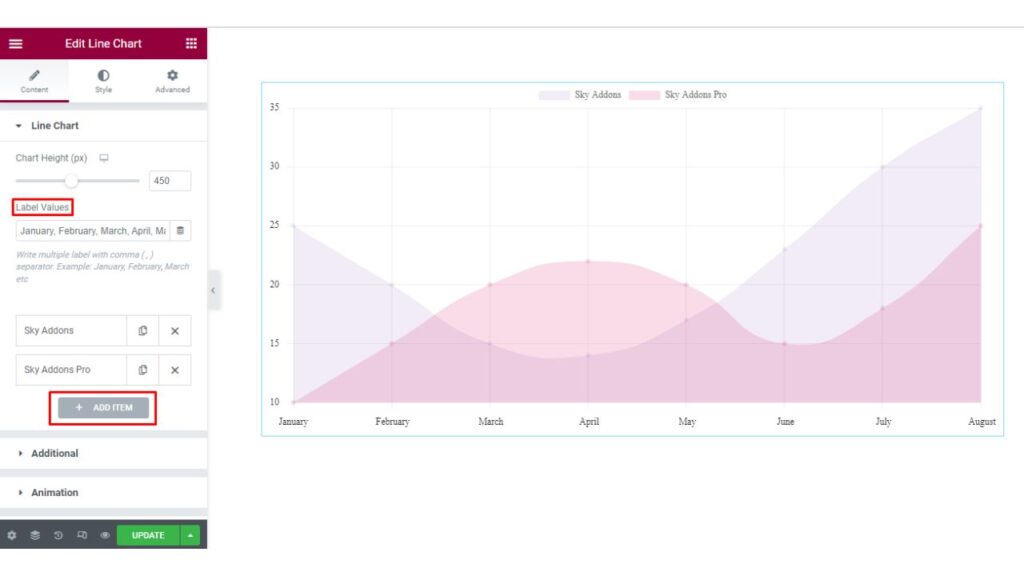
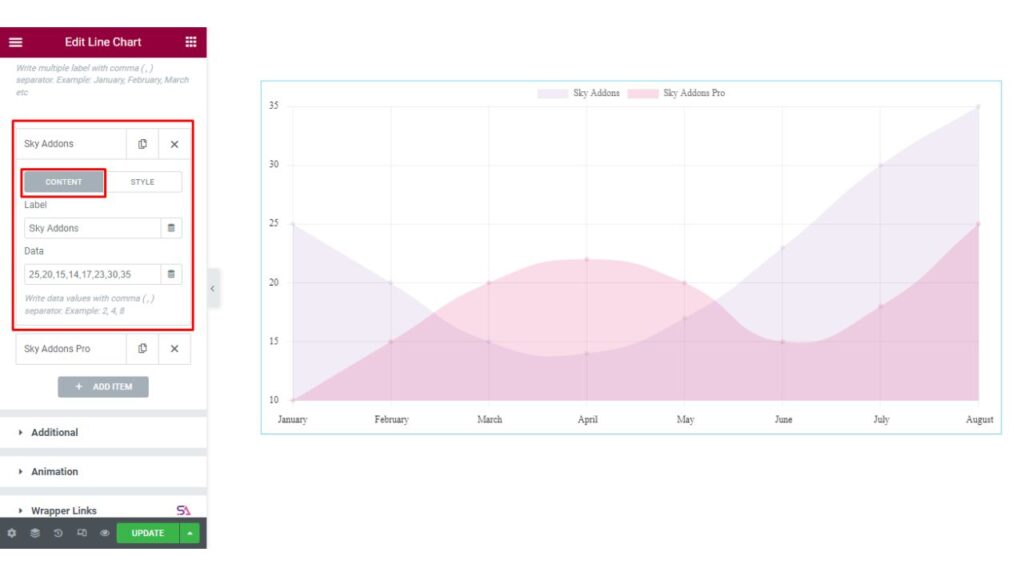
The first section here is the Line Chart section, Here you will be able to change the Chart Height. You can add Label Values. You can add as many as items you want to add just by clicking on the Add Item button.
Label Values: Label values in a Chart refer to the values displayed on or near each bar in the chart. These values represent the height or length of the bars and provide a way to compare and visualize data. Labels can be displayed directly on the bars themselves, or next to them, and can be formatted to show specific units of measurement, such as dollars, percent, etc. The use of label values helps to provide context and understanding for the data being displayed in the chart.
Here you can Write multiple labels with a Comma ( , ) Separator. Example: January, February, March, etc.
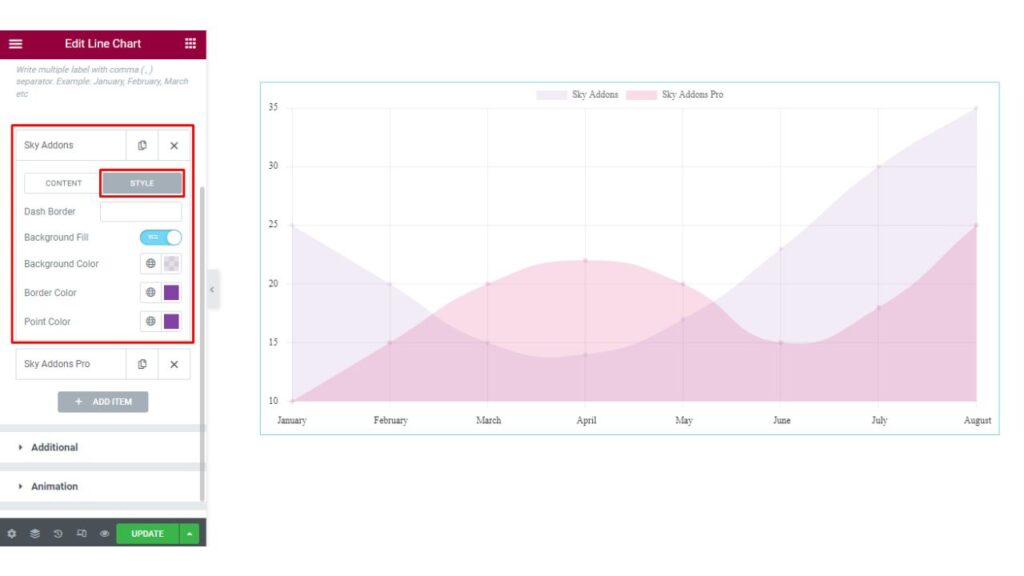
When you will click on any Item, there you will find Content and Style options. The Content option allows you to add the Label Text and Data.
On the other hand, the other option here is the Style option. This allows you to Change the Background Color, Background Hover Color, Border Color, and Hover Border Color.
Additional
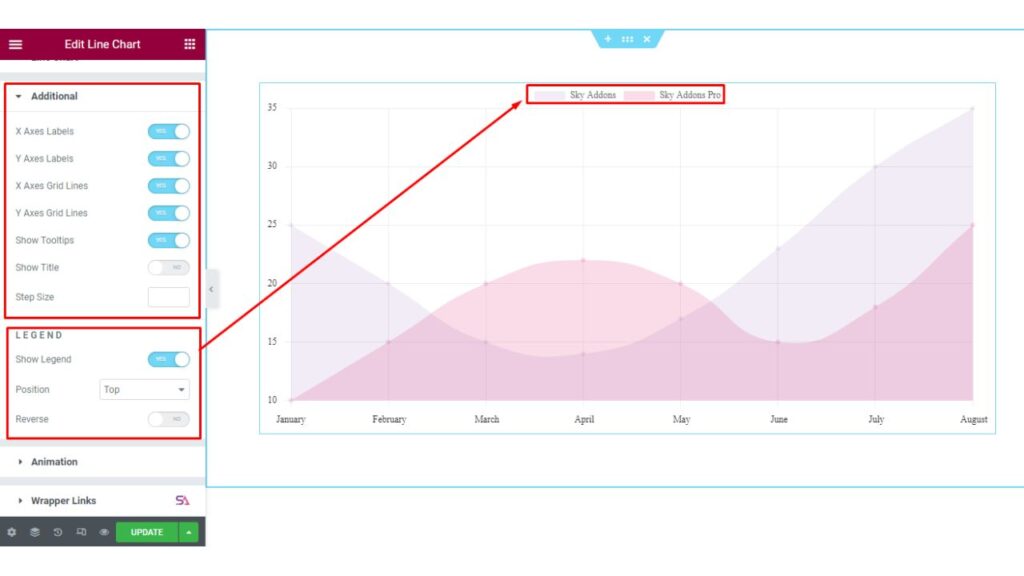
Now the next section is the Additional section. Here you can enable/disable X and Y axes Labels and Grid Lines. If you want to show the tooltip, then you can enable that option. Otherwise, disable it.
At the bottom of this section, you will find an option named Legend. For those who are not familiar with the term called Legend, we will describe first what is Legend in a Chart.
Legend: A Legend in a bar chart is a visual element that explains what each color or pattern in the chart represents.
It is typically located outside of the main chart area and maps the elements in the chart (such as bars, lines, or markers) to a corresponding description or label. The legend can be used to distinguish between different data series, variables, or categories in the chart. It helps to provide clarity and context to the chart, making it easier for the viewer to understand and interpret the data.
Here you may enable/disable the Show Legend option and Change the Legend’s position. You can also Reverse the Legend just by enabling the Reverse option.
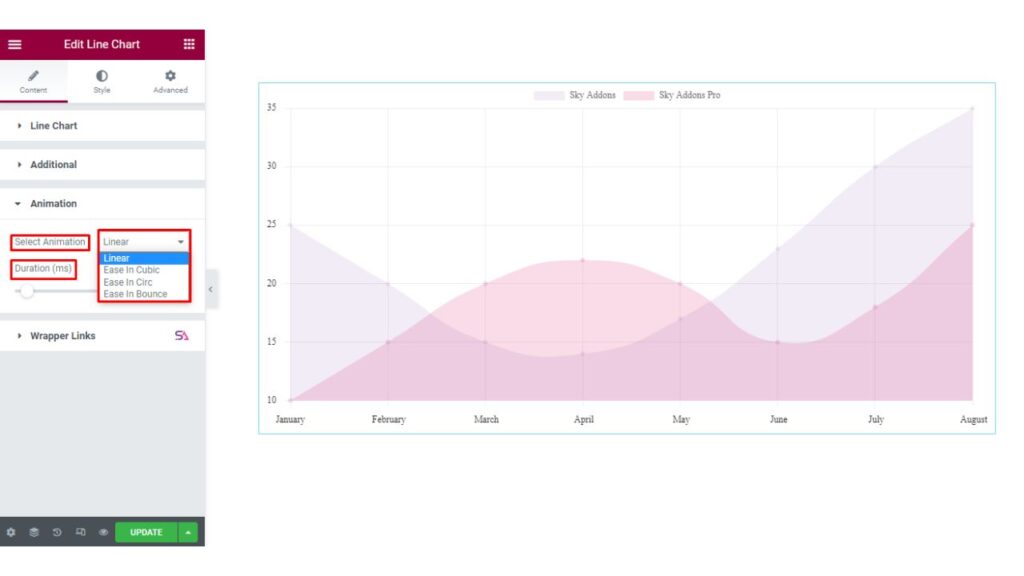
Animation
In the Animation section, you can select the Animation Type. You can choose from Linear, Ease in Cubic, Ease in Cric, and Ease in Bounce options. You may also adjust the Animation Duration according to your choice.
Style Tab
Now we move to the Style tab. Here you will find all the styling options. In this Style tab, there are 4 sections. They are Chart, Legend, Labels, and Tooltip.
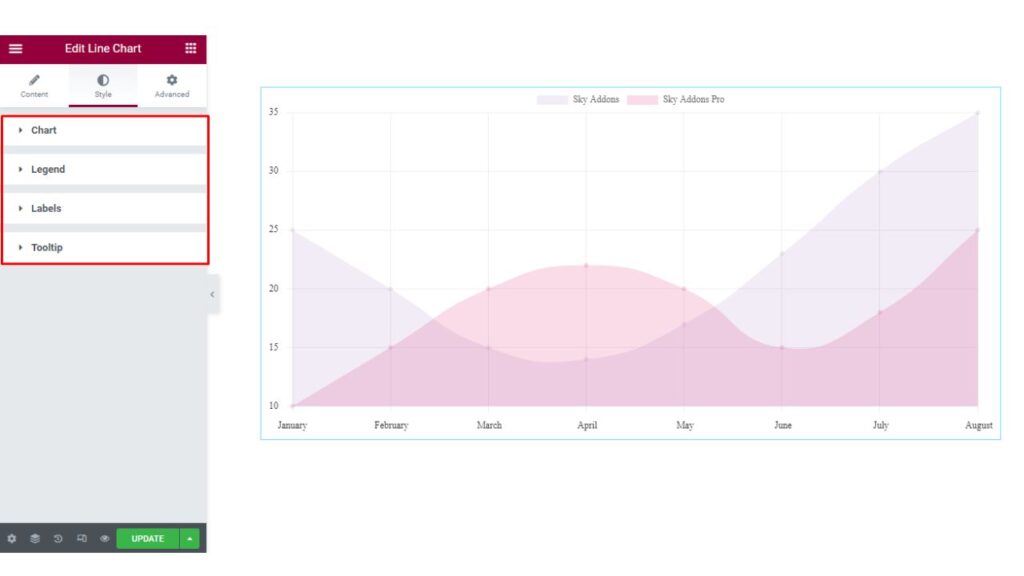
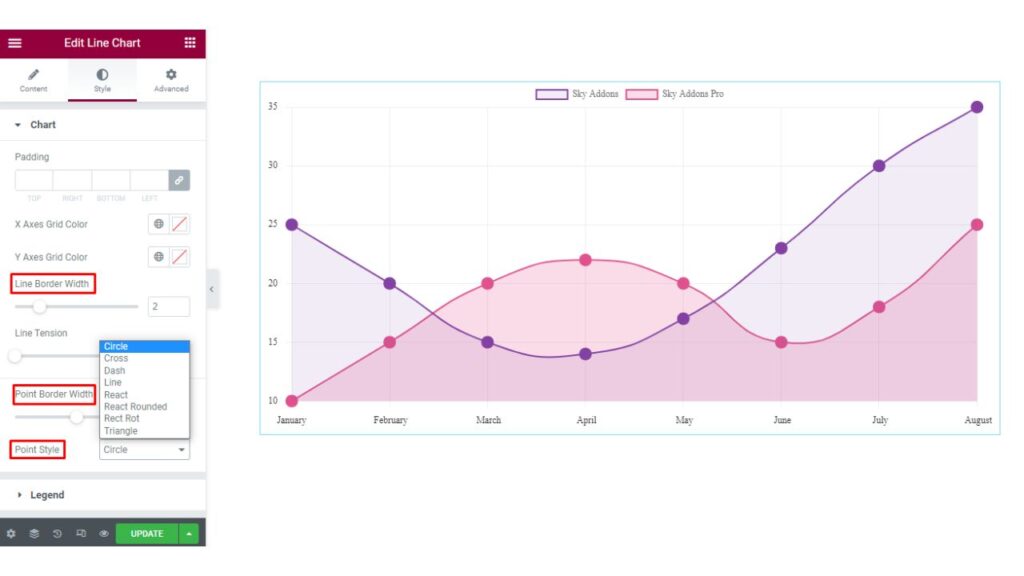
Chart
Firstly in the Chart section, you will be able to adjust the padding of the Line Chart. You can change X and Y axes Grid Colors.
You may adjust the Line Border Width, Line Tension, and Point Border Width. You can also select the Point Styles from here.
Line Tension: A line chart is a graphical representation of data that uses lines to connect individual data points. Line Tension is a property of a line chart that determines how the line is drawn between data points. The line tension can be used to control the appearance of a line chart and can be used to create different visual effects.
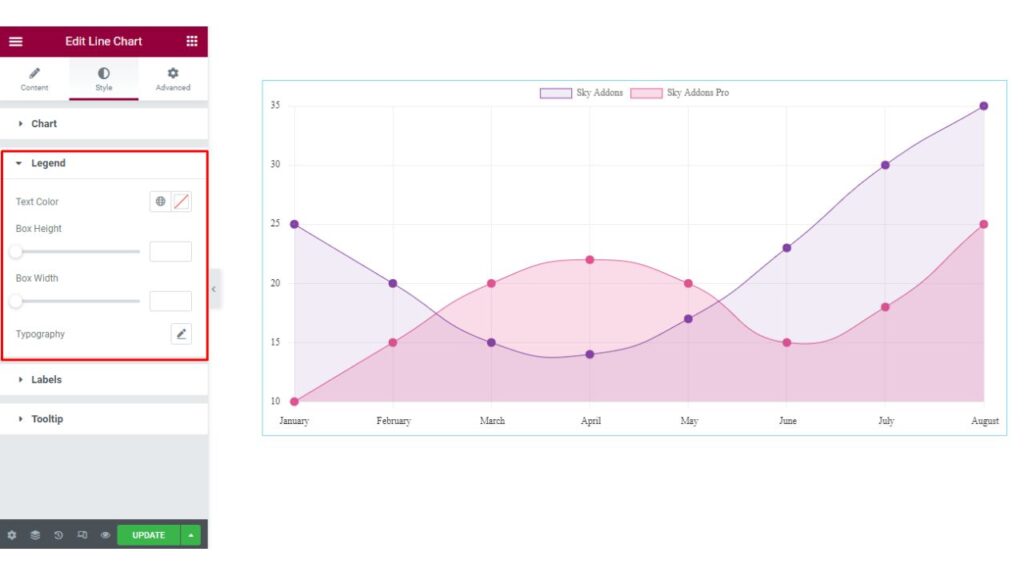
Legend
In the Legend section. Here you are allowed to change the Legend’s Text Color, Box-Height, Bar-Width, etc.
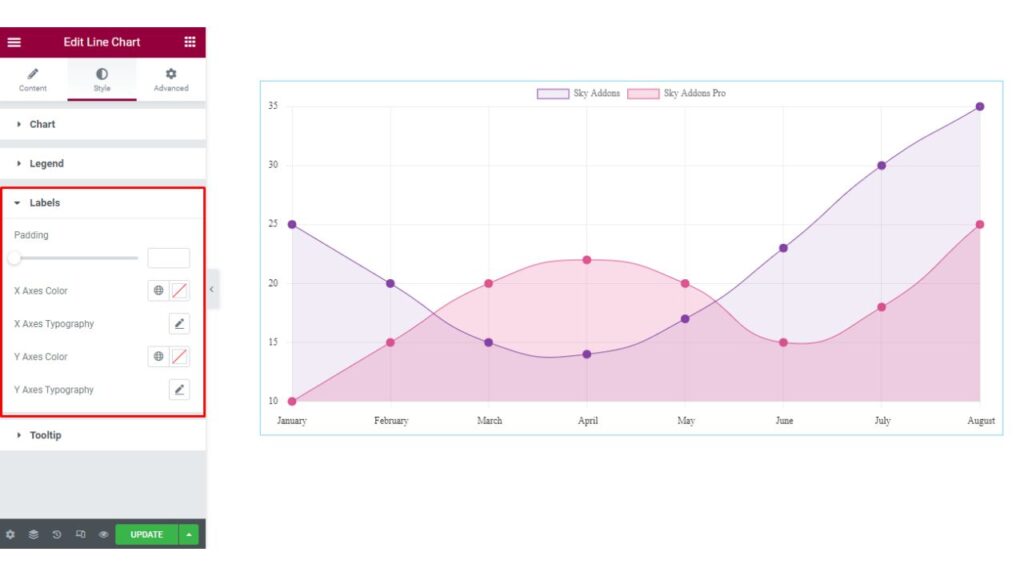
Labels
The next section is the Labels section. Here you can style your Line Chart’s Label by adjusting its Padding. Changing the X and Y axes Color and Typography.
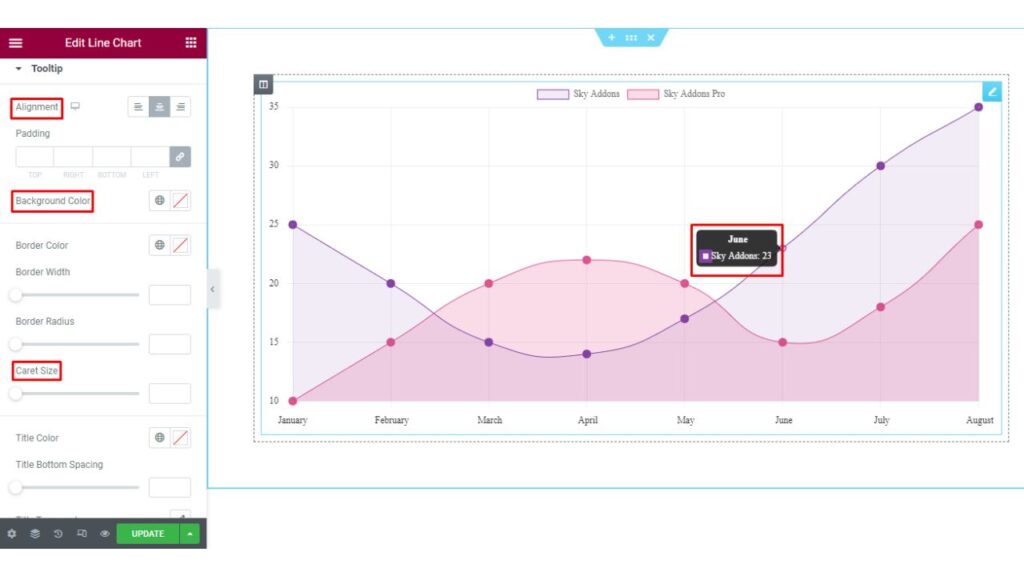
Tooltip
The last section is the Tooltip section. In this section, you may set the Alignment of the Tooltip. You can Style the Tooltip by changing the Color, Typography, Background Color & other aspects as per your needs.
Once you made all the changes in the style tab your Line Chart will look Fantastic.
That’s it. we are done with the tutorial. We hope that you have understood the whole process of using the Line Chart widget of Sky Addons in Elementor.
If you have any questions or queries regarding this please feel free to contact our website – https://wowdevs.com/support/
and don’t forget to visit our demo website – https://demo.skyaddons.com/elementor-line-chart-widget/